


Nasdaq 100 Chart Signals: Critical Levels to Watch and Signs of Declining Bullish Momentum
As Wall Street’s unwavering enthusiasm for the artificial intelligence (AI) narrative drove companies tied to the technology, the tech-heavy Nasdaq 100 Index continued to achieve record highs, climbing nearly 8% in the second quarter.
- After increasing by almost 8% in the second quarter, the tech-heavy Nasdaq 100 Index has continued to reach all-time highs, driven higher by firms associated with AI and Wall Street’s unwavering enthusiasm for the story.
- It appears that buy-side pressure is lessening when trade volume declines and the price and relative strength index indication diverge.
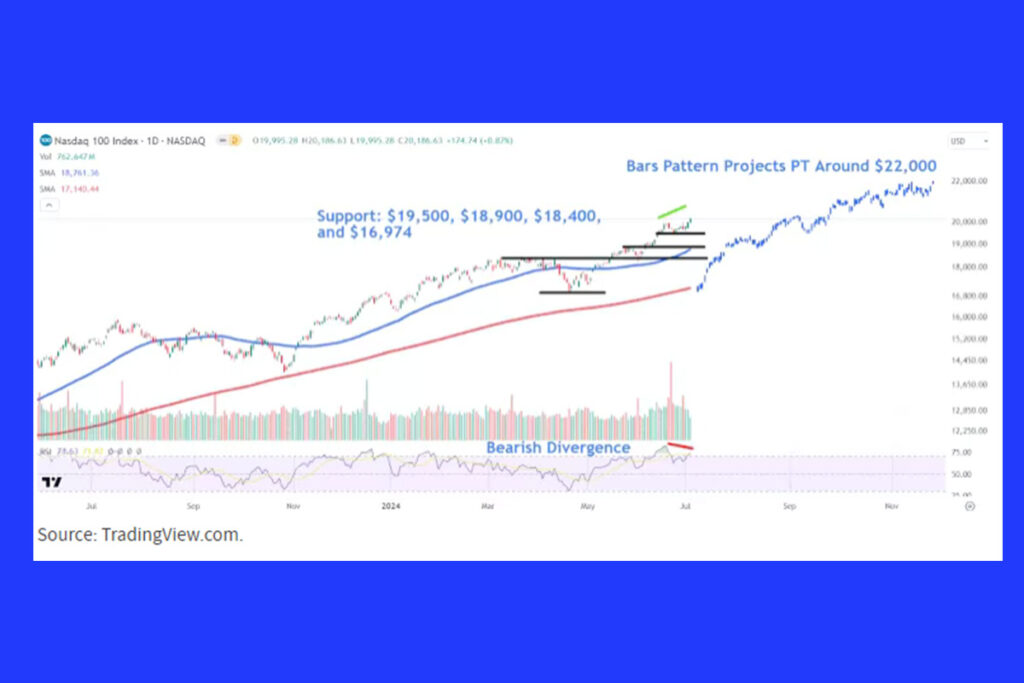
- At significant levels like 19,500, 18,900, 18,400, and 16,974, the Nasdaq 100 index may find support.
- The price goal of around 22,000 is projected by a bars overlay pattern that adds the index’s trending advance from October of last year to March of this year to the April swing bottom.
Nasdaq Momentum Slows Despite Record Highs: Key Indicators and Analysis
The index has been trending higher since bottoming out in the middle of the 50-day and 200-day moving averages (MAs) in mid-April, with the price establishing a record close on Wednesday. Even though the Nasdaq reached fresh highs, the momentum appears to be slowing down, according to a few chart indicators.
- First off, the shorter trading week may have contributed to the recent drop in trade volume, despite it still being above longer-term averages.
- Second, the relative strength index (RSI) signaled a bearish divergence, indicating a reduction in buy-side pressure, as the price surged to a higher high this week.
A continuation of the downward trend might lead to a retest of the important 18,400 regions, where buyers are likely to be found along a trendline connecting many price points surrounding the index’s last all-time high (ATH), which seems to have turned from a resistance to a support area.
For more up-to-date crypto news, you can follow Crypto Data Space.
Leave a Reply