


Analyzing Stock Market Trends: Dow Jones, S&P 500, Nasdaq Expectations Updated with Powell and Employment Data
Seasonality and holiday trading provide a climate that allows US market indices to easily build on their recent gains at the beginning of a new quarter. But after such a powerful rally, exhaustion seems to be setting in, so a retreat might be forthcoming.
- US non-farm payrolls and ISM Non-Manufacturing PMI data to be released
- Analysis of hard economic data according to surveys
- Jerome Powell and ECB President Christine Lagarde speak on Tuesday
- Shortened trade week with the official Independence Day holiday falling on Thursday
Payrolls Report and ISM Non-Manufacturing PMI Stand Out as Two Key Data Highlights

The schedule of important US economic data releases is provided above. Notably, the June Eurozone inflation report could have a significant impact on US bond markets, considering the recent responses to inflation readings from other industrialized nations. Everything has the potential to affect US indices. Still, with mounting evidence that US economic activity is beginning to slow down, the payrolls report and the ISM non-manufacturing PMI are shaping up as the two most important events.
You cannot avoid the fact that the markets will first respond to the headline payroll figure in the jobs report. However, considering the consequences of consumer spending and service inflation, the jobless rate and average hourly earnings data appear to be more significant when it comes to what the Fed will be looking at.
- If it gets too strong, it might affect borrowing costs and offshore earnings by raising bond yields and the dollar’s value.
- If it is too weak, it can be a sign that the US economy is about to collapse.
Lagarde and Powell to Deliver a Panel Discussion in Portugal
A panel discussion including Federal Reserve Chair Jerome Powell and ECB President Christine Lagarde took place on Tuesday at the ECB’s Forum in Portugal. John Williams, the president of the New York Fed, is scheduled to take part in a panel discussion regarding the neutral interest rate. It seems especially significant for more cyclically driven equity indices, such as the Dow and Russell 2000, given the Fed’s emphasis on rate reductions.
Dow Jones Futures: Breaking Through Resistance Last Week with Bullish Signals in a Pennant Pattern
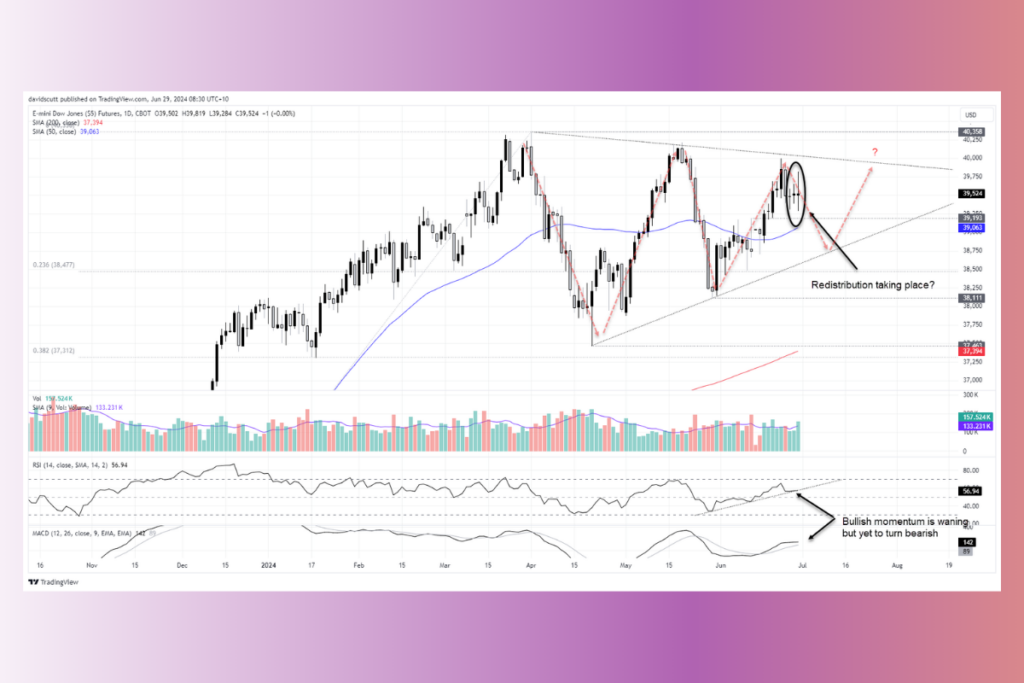
Early last week, Dow Jones futures appeared to be breaking through topside resistance, as is customary when coiling in a pennant pattern. Though they pulled back before printing three consecutive doji candles on the daily, futures came dangerously close to being rejected. The bullish momentum that was observed throughout June appears to be fading, indicating that short-term risks may be skewing lower, even though momentum indicators have not yet turned bearish.
- The support levels to monitor on the downside are 39193, 38477, the 50-day moving average, the pennant support at 38700, and the 23.6% fib retracement of the Oct-Apr gain.
- The first level of note is pennant resistance about 40000, and the record high is 40358 at the next level below.
S&P 500 & Nasdaq 100 Futures
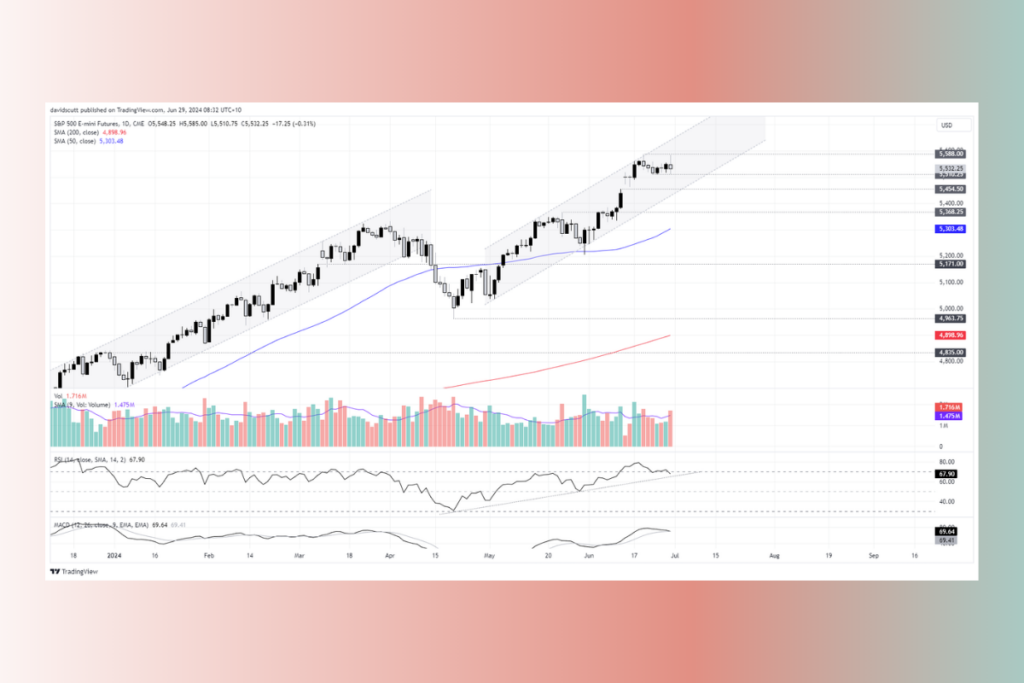
Within a larger positive rise, S&P 500 futures are safely positioned in a sideways range. Over the last two weeks, the price has been forced back to the support level at 5510.25 after being rejected twice at the record high of 5588. Though RSI is still in a strong upswing, MACD has produced a bearish signal from a momentum standpoint that needs confirmation.
- The first significant layers of support are 5510.25, 5454.50, 5368.25, and the 50-day moving average.
- If the record highs are broken, the market will likely move toward large numbers on the upside.
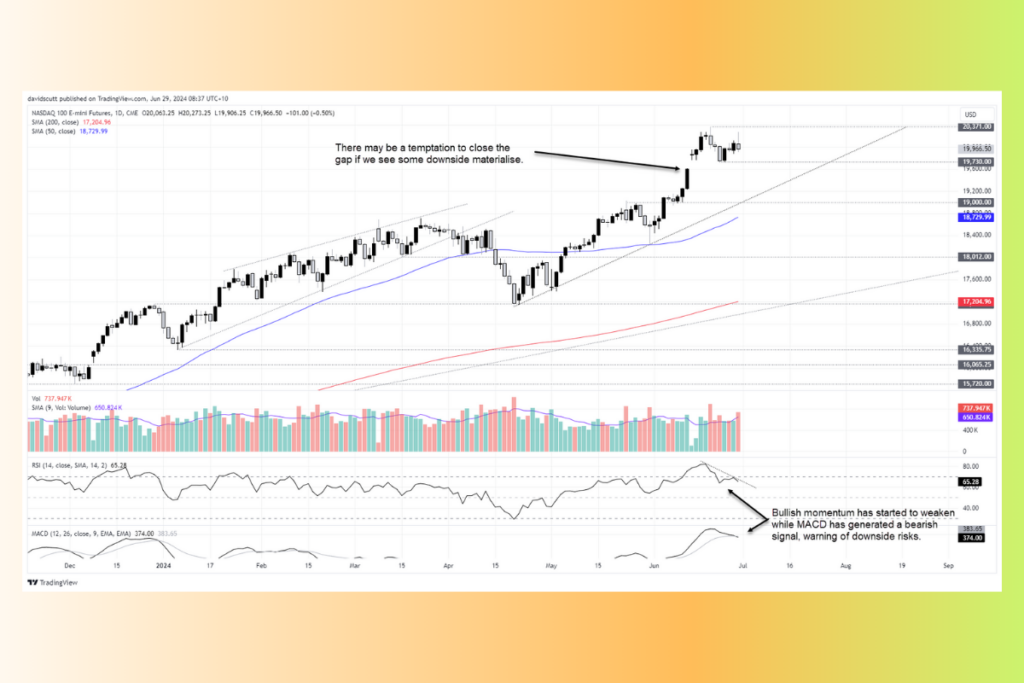
Futures have been stabilizing in a narrow range between 19730 on the downside and 20371 on the topside since they gapped higher on June 13. That is the starting range that traders can operate in. Despite the nearly universally bullish price movement this year, some indications of rally fatigue are beginning to appear.
On the other hand, momentum indicators support this theory, with the RSI going lower and the MACD crossing over from above to indicate dangers to the downside. The start of a new quarter and a week with fewer holidays may indicate increased downside risk, but it shouldn’t rule out the possibility that the Nasdaq can suddenly soar higher and break all previous records.
For more up-to-date crypto news, you can follow Crypto Data Space.
Leave a Reply